


Truly dramatic changes over the past few years:
- We’ve lived through the worst pandemic since 1918
- We’ve had to manage an energy price shock driven by Russia’s invasion of Ukraine
- We’ve experienced the fastest increase in inflation since the 1980s, and
- The sharpest rise in interest rates in over 40 years.
Despite these difficulties, human ingenuity, strong policy responses and some luck has allowed life to largely return to normal. Most economies have now recovered to pre-Covid levels, and most companies and markets have more than made up losses incurred during the pandemic.
Most economies have recovered to pre-pandemic levels
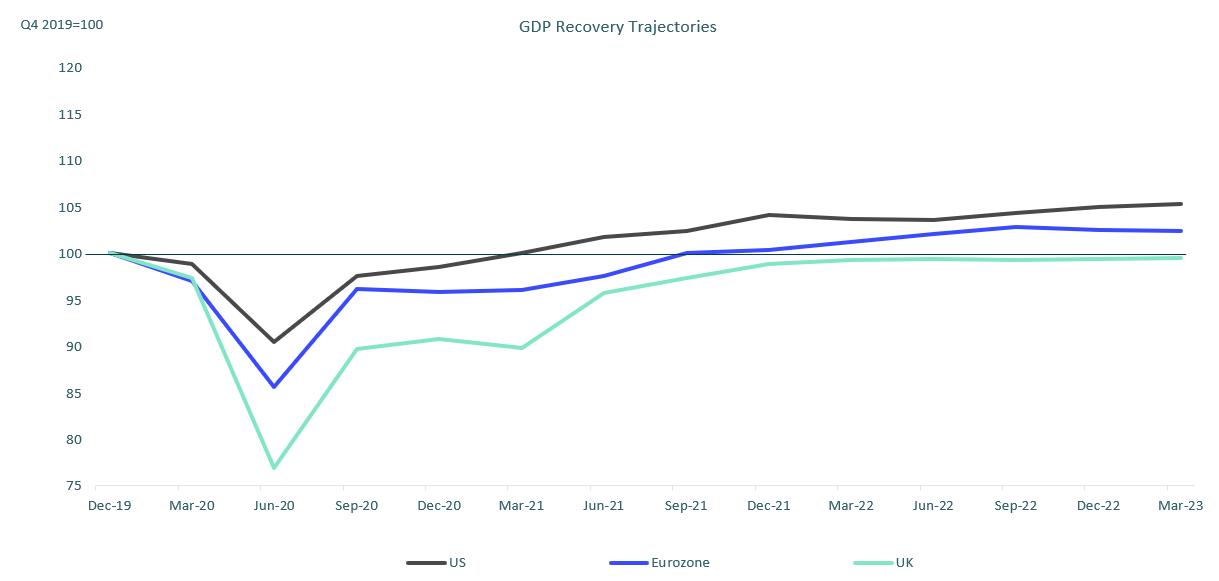
Where do we go from here?
I think there’s little question that the sharp rise in interest rates over the past 18 months and the hit to disposable incomes from the rise in inflation are still feeding through the system.
Generally monetary policy works with a lag, and during this cycle, I think the lag has been longer than usual, in large part, because of the substantial savings built up during COVID.
However, as those savings dwindle over the coming quarters, the impact is likely to become much more apparent. Private consumption and investment are likely to slow, particularly in more cyclical and interest rate sensitive sectors. Ultimately, this should take pressure off wages and inflation and allow interest rates to fall again. But in the meantime, investors will likely have to contend with slower growth, sticky core inflation and interest rates that have to stay higher for longer.
What does this mean for the investment environment?
I would argue that the most critical immediate question for investors is how severe the slowdown will be and what that might mean for company earnings and broader company fundamentals.
In our view, for most countries the slowdowns will be relatively moderate when compared to the deep downturns experienced during the 2008 global financial crisis. The critical difference between the 2008 crisis and the situation today is the strength of the global banking system.
Looking at data back to the 1920s, deep recessions have always been accompanied by systemic financial crises. And given the crucial role banks have historically played in creating credit, this shouldn’t come as a surprise.
While US regional banks are facing difficulties, their problems have been largely contained to the sector.
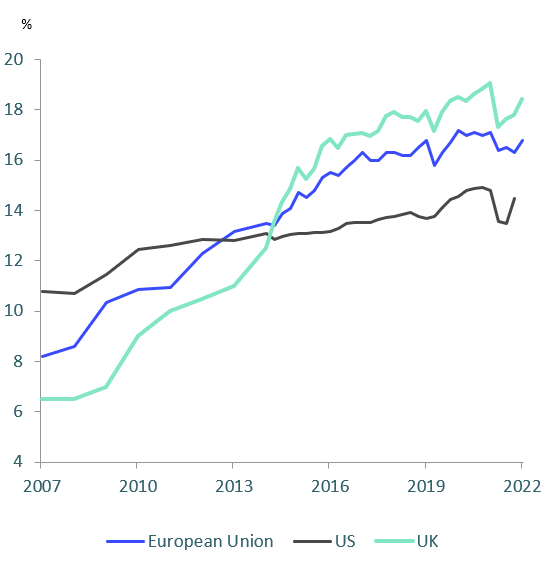
Most critically, the world’s global systemically important banks remain in good shape:
- Balance sheets are strong, with the tier one capital ratios of European and UK banks more than double 2008 levels
- Liquidity buffers are large, and
- Banks are now stressed tested by regulators on a regular basis.
Risk of systemic global financial crisis is low
Bank tier one capital ratios
Bank liquid reserves to bank assets ratio
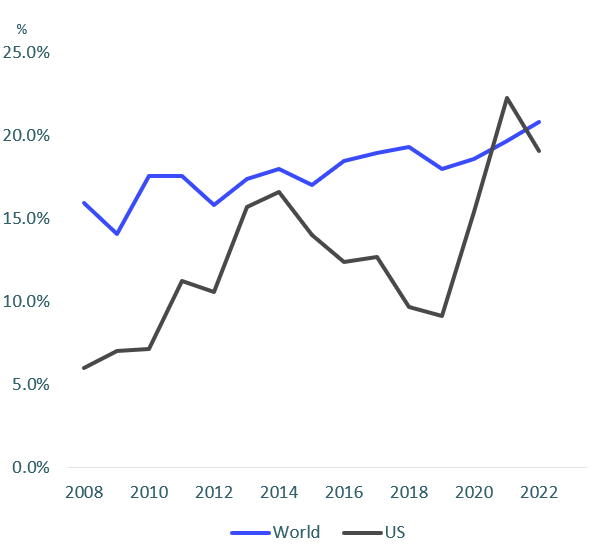
This makes the risk of a systemic global financial crisis very low in our view.
If this is correct, than the economic slowdown ahead is likely to be much more moderate and much more sector specific than the deep and broad based recessions experienced during the 2008 global financial crisis.
While some countries may see some quarters of negative growth, unless we experience another large external shock, deep across-the-board recessions are unlikely in our view.
GDP growth outlook: Slower growth ahead
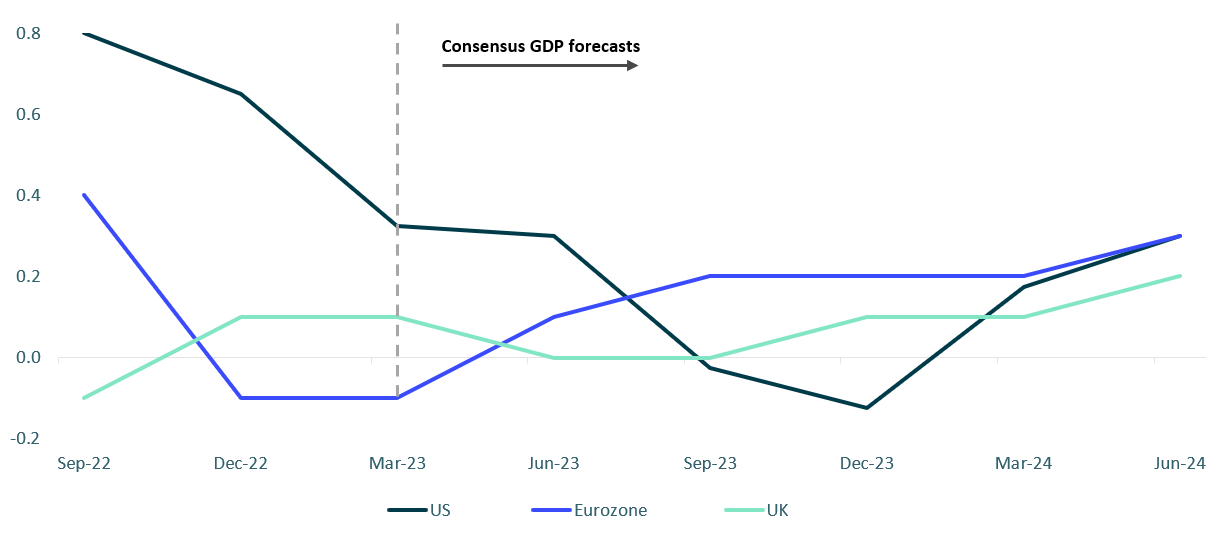
As you can see in the chart (above), consensus forecasts are for quite moderate slowdowns across major developed economies. The IMF and most central bank forecasts are very similar.
While the downturns may ultimately prove to be somewhat deeper and longer than these forecasts, we think that similar to what we saw during the COVID period, a key feature of the slowdowns is that there will likely be wide performance dispersion at a sector level. This should play to the strengths of investors that have long term investment horizons and strong bottom-up analytical capabilities.
Biggest risks and opportunities
The most vulnerable sectors in our view will be cyclical and interest rate sensitive industries with limited pricing power.
Sector-specific slowdown ahead: Most at risk
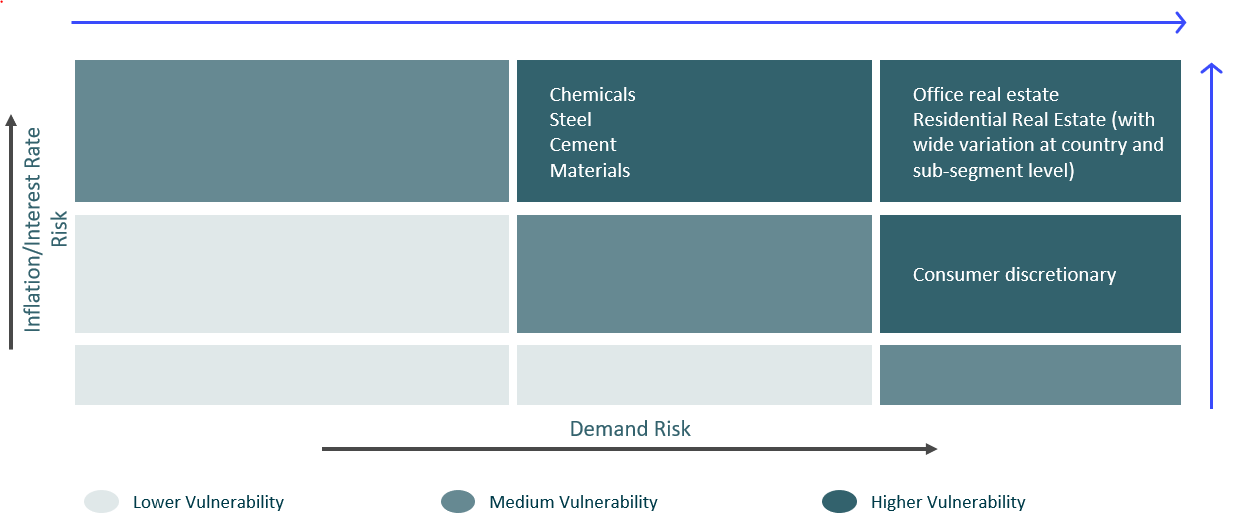
Heavy Industry and basic materials are particularly vulnerable, with chemicals, steel, many of the materials sub sectors and traditional energy likely to see intensified pressure on top lines and margins.
Real Estate, particularly the office sector, as well as parts of the residential sector, are likely to remain under pressure. Consumer discretionary spending is likely to slow with a number of retail sub sectors and big ticket consumer durables such as autos most at risk.
Sector-specific slowdown ahead: Least at risk
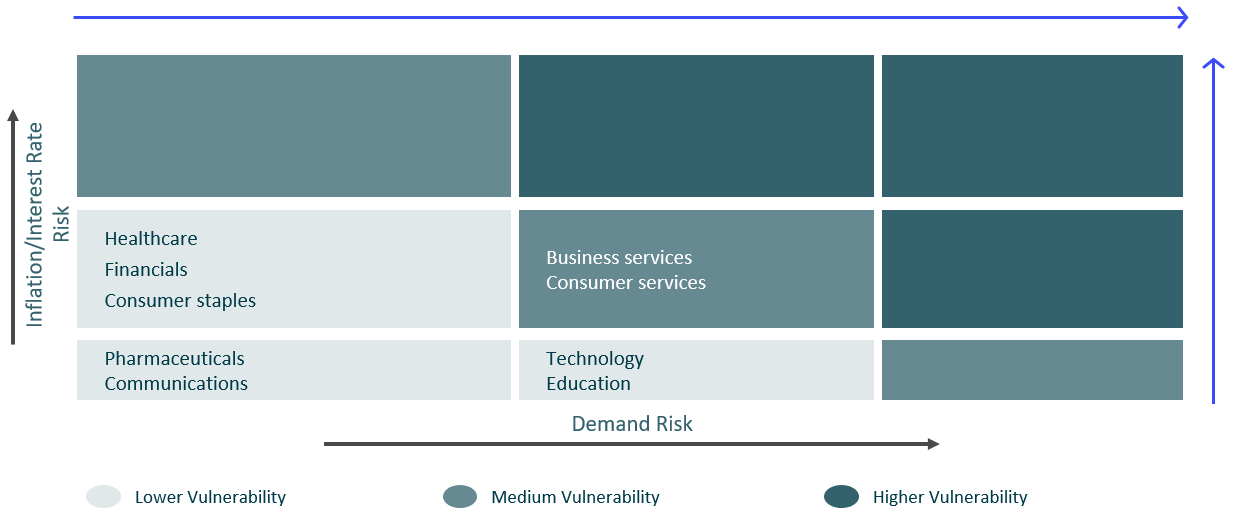
However, it’s not all bad news. Less cyclical sectors should fare relatively well in our view.
Many technology sub sectors are well positioned in this environment. Healthcare, while having to contend with continued input cost inflation, should continue to see steady top-line growth. Education, communications, business and financial services, infrastructure, and companies supporting the green energy transition, are all areas that should continue to perform well in our view.
What this means for private markets
Most private companies enter this more difficult economic environment in strong shape.
As many of you know at ICG we’ve built a large database of private company fundamentals that allows us to track the health of private companies across countries and sectors in Europe in the US. The database has information on nearly 1500 private companies and over 14 years of tracking data.
Private company fundamentals remain strong
US and Europe private company interest coverage ratios (EBITDA/net cash interest)
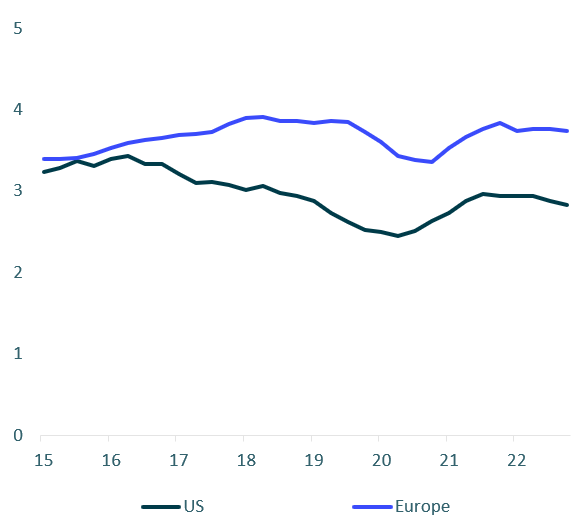
Source: ICG Private Company Database (data up to 31 December 2022)
US and Europe private company EBITDA growth (YoY%)
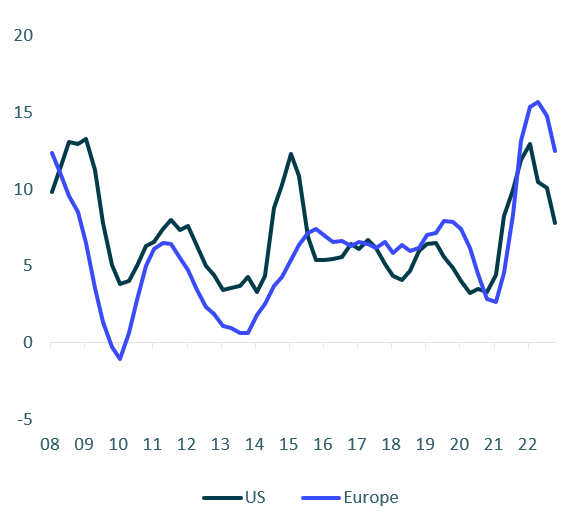
As you can see from the charts (above), on our latest aggregated data, fundamentals as measured by interest coverage and EBITDA growth, remained strong through 2022.
Interest coverage has held at high levels as healthy EBITDA growth has more than compensated for higher interest rates. Bottom up data indicates this trend has continued into 2023.
While key metrics at an aggregate level are likely to weaken in the coming quarters, they are coming from a strong starting point.
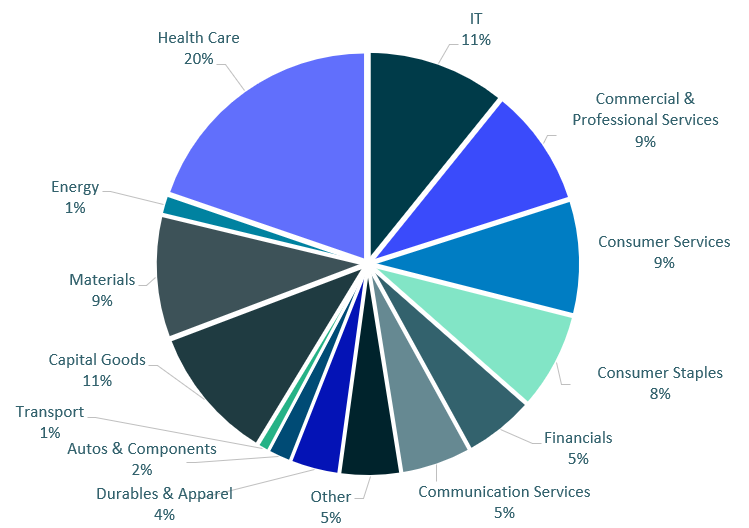
Another key strength of private markets relative to public markets, is the skew towards the less vulnerable sectors I mentioned earlier:
- Their limited exposure to cyclical and interest rate sensitive sectors, and
- Their focus on companies with high free cash flow, strong pricing power, and industries with secular tailwinds.
Focus on less cyclical, high cashflow companies
Private Company Database: exposure by sector
This is evident looking at the long term EBITDA growth of the private companies tracked by ICG’s Private Company Database.
As a very simple exercise. We plotted historical Europe private company EBITDA growth back to 2008 against Europe’s GDP growth over the same period. We then added in the highest, lowest and median consensus GDP growth forecasts out to 2024.
Where to from here?
Growth in European private company EBITDA vs Eurozone GDP (YoY%)
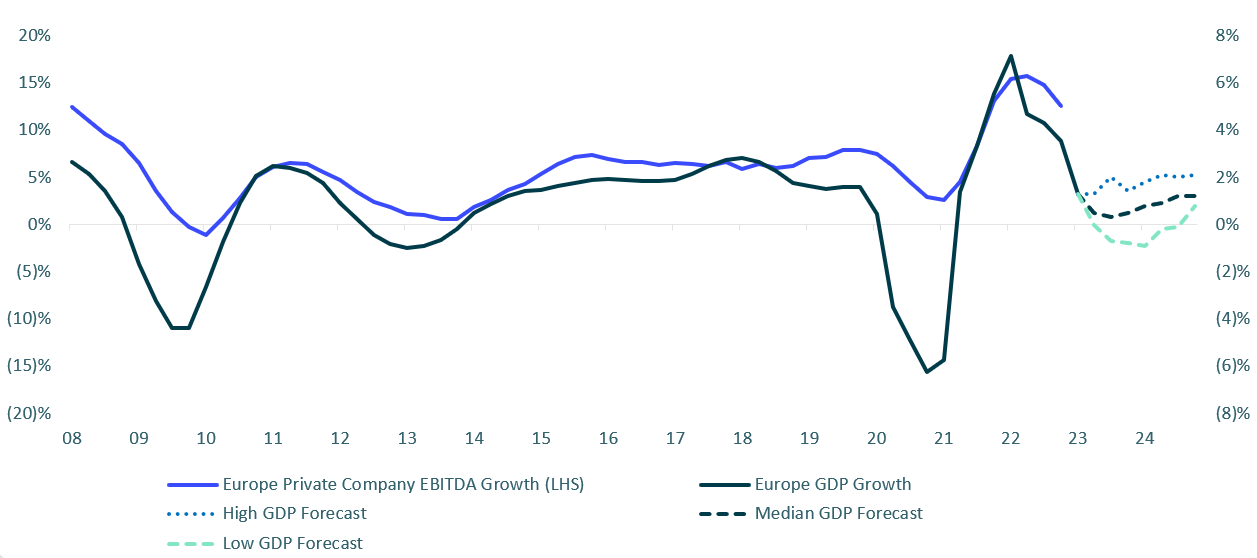
Sources: ICG Private Company Database (data up to 31 December 2022) – Average EBITDA growth is calculated on an equal-weighted basis. Bloomberg (data as at 20 June 2023)
Two key things stand out:
- Directionally EBITDA growth tracks GDP growth, as one might expect. It also tends to show much less pronounced swings than GDP, reflecting the less cyclical nature of the company’s private market investors tend to invest in.
- Even the current lowest consensus GDP forecast puts a slowdown at around half the magnitude of the 2008 global financial crisis.
Therefore, if correct, while companies – private and public – may face a more difficult operating environment in the coming quarters, we think private market investors are particularly well positioned. With stable, long-term sources of funding, a rigorous bottom-up approach to investing, and large stores of dry powder, private market investors are able to take a long-term view of a company’s fundamentals, work with management through difficult times, and find new opportunities during periods of disruption. This held private markets investors in good stead through the Covid pandemic, and we believe it should do so again as we enter this more challenging economic environment.