


Summary
- In January 2023, we published a review of cross-market long-term return profiles and the importance of entry points on long-term return outcomes: Long term case for sub-IG credit: Jan 2023.
- In light of the strong performance since our initial publication, we have updated the dataset to understand what current spreads imply for future outcomes.
- The data shows:
- For loans, the 2023 spread tightening has a slight negative impact on prospective returns based on the historical dataset. However, year-end 2023 credit spreads remain consistent with a moderate, positive excess return outcome.
- The data is mixed in high yield. Dispersion is higher and the range captures some negative return outcomes, specifically in US high yield. While current European high yield spreads remain consistent with a range of neutral-positive return outcomes, current US high yield spreads have coincided with a wider range historically, including several negative datapoints.
- The data corroborates with where we see value in global sub-IG:
- We prefer loans to high yield
- US high yield remains our deepest underweight
- In our view, high yield is expensive, reflecting the relative behaviour of global sub-IG credit spreads since 2021. High yield widened by less in 2022 and saw heavy spread compression after the Federal Reserve indicated a pivot in late 2023. US high yield is only 36bps wide of year-end 2021 credit spreads at the index level.
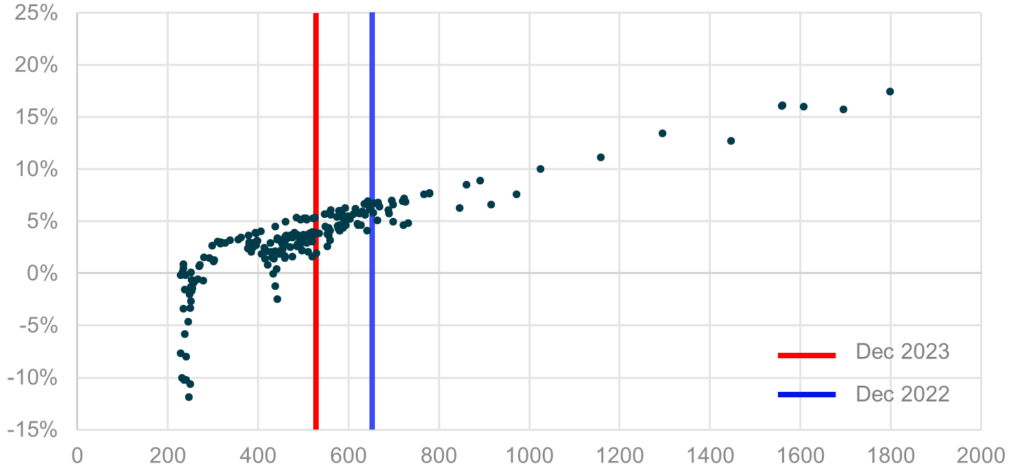
Relationship between credit spread & 3-year returns
US loans: 3-year DM vs 3-year ann. return over T-Bills (3-years forward)
European loans: 3-year DM vs 3-year ann. return over T-Bills (3-years forward)
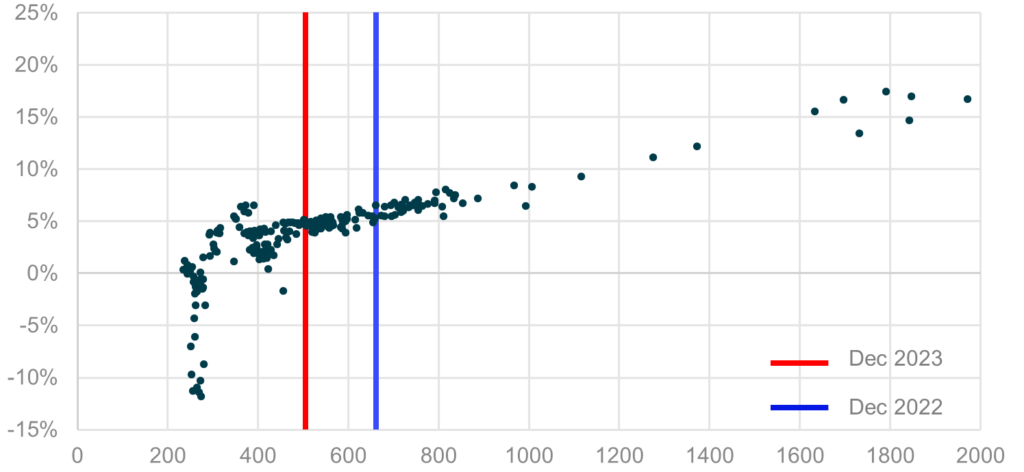
US HY: Spread vs gov’t vs 3-year ann. return over T-Bills (3-years forward)
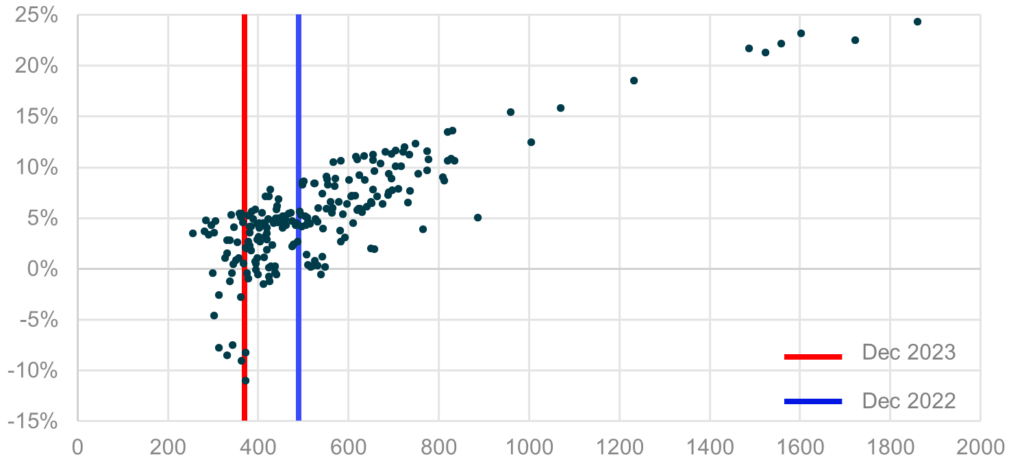
European HY: Spread vs gov’t vs 3-year ann. return over T-Bills (3-years forward)
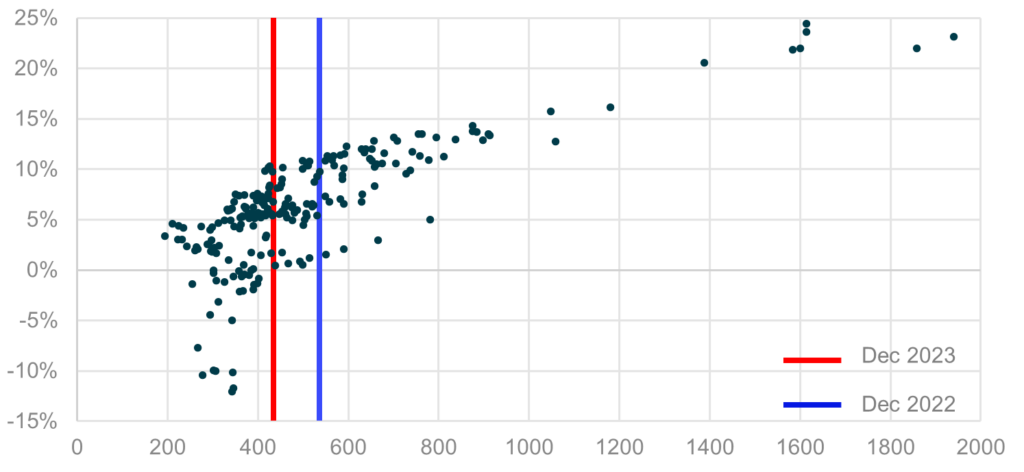
Past performance is not necessarily indicative of future results.
Source: ‘US loans’ is Credit Suisse Leveraged Loan Index, ‘European Loans’ is Credit Suisse Western European Leveraged Loan Index, ‘US HY’ is ICE BofA US Non-Financial High Yield Constrained Index (HCNF), and ‘European HY’ is ICE BofA European Currency Non-Financial High Yield 3% Constrained Index (HPID), January 2006 – December 2023. Each data point is the credit spread at the beginning of 3-year annualised holding period return between January 2006 and December 2023.
2022-2023 change in sub-IG credit spreads
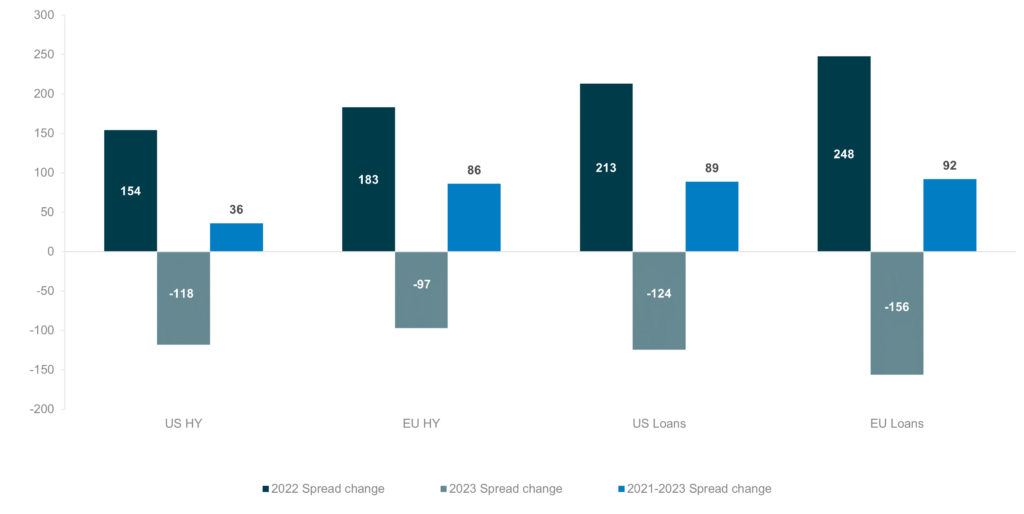
Past performance is not necessarily indicative of future results.
Source: ICG, December 2023. Credit Suisse Western European Leveraged Loan Index, Credit Suisse Leveraged Loan Index, HCNF index, HPID index. Bond spread: STW vs government.