


Highlights
Strategic and AUM
- Delivering significant growth from flagship and scaling strategies, maintaining disciplined approach to investment performance and a focus on cash realisations (DPI)
- AUM of $126bn; fee-earning AUM of $87bn, up 11%1 y-o-y, five-year annualised growth of 14%1
- Fundraising of $17bn, exceeding our expectations
Financial
- Financial presentation evolved to be in line with global alternative asset management peers, in particular a focus on FRE
- Management fees of £685m, up 13%2 y-o-y; FRE of £350m / 120p per share up 23%3 y-o-y, five-year annualised growth of 30%3
- Performance fee income of £127m4 (FY25: £86m)
- Balance sheet investment portfolio5 of £2,568m
- Group operating cashflow of £861m (FY25: £533m)
- Net debt of £113m (FY25: £629m), Total Available Liquidity of £1,461m (FY25: £1,098m)
Shareholder returns
- Total ordinary dividend per share for FY26 of 87p6 (FY25: 83p), 16th consecutive annual increase
Note: unless otherwise stated the financial results discussed herein are on the basis of Alternative Performance Measures (APM) – see page 3. See page 14 for information on closing number of shares and weighted average number of shares used for per-share calculations.
1 On a constant currency basis. 2 +17% excluding catch-up fees. 3 FRE growth on a per share basis. 4 Includes £72m of one-off transition impact due to change in estimate announced in October 2025. 5 Balance sheet portfolio is presented net of the DVB liability, see Glossary on page 83. 6 Dividends are payable both to Ordinary Shares and to Non-Voting Shares. See announcement on 18 November 2025 for details.
CIO & CEO video summary

Benoît Durteste, CEO and CIO:
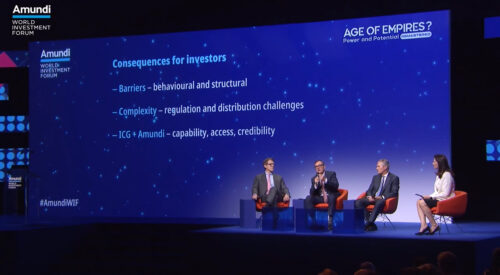
FY26 was a strong year for ICG. We reinforced our scaled competitive position, established a strategic relationship with Amundi, and built on our track record of strategic and financial resilience.
In an environment where liquidity and selectivity matter more than ever, we have maintained a disciplined approach to investments, with particular focus on cash realisations (DPI).
Strong performance is driving increasing client demand. Europe IX is expected to be ICG’s first-ever commingled fund to reach €10bn in size and is continuing to raise. And the successful final closes for Infrastructure II and Metropolitan II mean we have now had six funds close at or above their target in the last 24 months.
This approach has translated into strong financial results, including fee-related earnings (“FRE”) of £350m (120p per share), up 23% in the year, and Group operating cashflow of £861m.
We are experiencing clear demand from institutional allocators globally for our strategies, and are unaffected by challenges being faced by certain evergreen vehicles in the US. I believe ICG is well positioned to continue generating compounding long-term shareholder value.
Performance overview
Unless stated otherwise, the financial results discussed herein are on the basis of alternative performance measures (APM), which the Board believes assists shareholders in assessing the financial performance of the Group. See page 3 for further information.
Fee-earning AUM
| $bn | Structured Capital | Private Equity Secondaries | Structured Capital and Secondaries | Real Assets | Private Debt | Credit | Debt | Year ended 31 March 2026 | Year-on- year growth1 | Last five years CAGR1 |
| Fee-earning AUM | 25.9 | 17.2 | 43.1 | 9.8 | 14.3 | 19.3 | 33.6 | 86.5 | 11% | 14% |
| AUM not yet earning fees | 1.8 | 1.7 | 3.5 | 2.0 | 12.9 | 0.3 | 13.2 | 18.7 |
1 On constant currency basis.
Business activity
| $bn | Fundraising | Deployment1 | Realisations1,2 |
| Structured Capital and Secondaries | 7.0 | 6.2 | 1.2 |
| Real Assets | 5.5 | 2.5 | 1.6 |
| Debt3 | 4.1 | 5.4 | 4.0 |
| Total | 16.6 | 14.1 | 6.8 |
1 Direct investment strategies. 2 Realisations of fee-earning AUM. 3 Includes Deployment and Realisations for Private Debt only.
Financial performance
Refer to the Glossary on pages 83 – 86 for detailed definitions.
| £m | Year ended 31 March 2025 | Year ended 31 March 2026 | Year-on-year growth | Last five years CAGR |
| Management fees | 603.8 | 684.8 | 13% | 20% |
| Fee-related earnings (FRE) | 283.6 | 349.5 | 23% | 30% |
| Performance fee income | 86.2 | 127.0 | 47% | 19% |
| Balance sheet portfolio1 | 2,901 | 2,568 | ||
| Group operating cashflow | 533 | 861 | ||
| Net debt | 629 | 113 |
FRE per share
98p
120p
23%
30%
Performance fee income per share
30p
44p
47%
19%
Balance sheet portfolio per share
998p
883p
Net debt per share
216p
39p
Dividend per share2
83p
87p
5%
9%
1 Balance sheet portfolio is presented net of the DVB liability, see Glossary on page 84. 2 31 March 2026 dividend per share includes FY26 declared dividend.
Updated medium-term financial guidance
Financial guidance has been updated to reflect the evolution in presentation of our financial results. FMC margin guidance has been replaced with FRE margin guidance, and guidance on NIR has been removed. Guidance on fundraising and performance fees remains unchanged.
| Growth | Profitability | Performance fee income |
| Fundraising of at least $55bn in aggregate between 1 April 2024 and 31 March 2028 | FRE margin accretion (excluding catch-up fees) | Performance fee income to represent c. 10 – 20% of total fee income1 |
| FY26: $40bn raised since 1 April 2024 | FY26: +14% in L5Y | FY26: 10% average in L5Y1 |
1 Excluding £72m transition gain in FY26.
Full announcement PDF
Includes a notice about the use of alternative performance measures, the company timetable and the full report